

EUTECNIQ Sciences

See every page on one mapArrow keys move through results · Enter opens · Esc closes

Academy · Course 5 Published data Calculators

Soil and harvest set a botanical's metal content and chemistry, before any laboratory sees it

A toxic element followed from soil water into a root, a dried plant, an extract and a daily dose, against USP ⟨2232⟩ limits; then how harvest timing and drying change what a botanical contains.

Level
Introductory to intermediate
Reading time
About 30 minutes
Builds on
Botanical identity
Tools
2 calculators, 1 Sankey, 2 heat maps
3.4times the soil’s cadmium in cacao beans on soils below pH 5 (median of 108 observations)
40.6%of rasa shastra products held lead, mercury or arsenic, vs 17.1% of others
48%less leaf oil in Ocimum gratissimum dried at 60 °C
0.5µg/g USP ⟨2232⟩ component limit for cadmium and for lead, 10 g/day basis
At a glance

One in five Ayurvedic products bought online in 2005 contained detectable lead, mercury or arsenic

Saper et al. (2008): products ordered, analyzed and found to contain metalsPeer-reviewed data
Saper RB et al. JAMA 2008;300(8):915–923: 230 products ordered August–October 2005 from 25 websites, 193 analyzed by X-ray fluorescence, 20.7% (95% CI 15.2–27.1%) with detectable lead, mercury or arsenic; 40 products is computed from that share. Detection is not a dose; see the limits section.
Data table: the flow
Products in the Saper et al. (2008) survey
StepProducts
Ordered230
Analyzed by XRF193
Not analyzed37
Detectable Pb, Hg or As (20.7% of 193)40
None detected153

You will learn

  1. Why soil pH, organic matter and cation exchange change how much cadmium a plant takes up.
  2. How to calculate a bioconcentration factor, and why it is not a constant.
  3. How to carry a metal from soil to a daily dose and compare it with USP ⟨2232⟩.
  4. How to tell uptake from soil apart from contamination added after harvest.
  5. How harvest stage, season and drying change constituent content, with published numbers.
  6. Which WHO GACP and CITES rules apply to cultivated and wild-collected material.
1 · Soil chemistry

Roots take up the dissolved fraction of a soil metal, and soil pH sets how large that fraction is
Four soil pools exchange cadmium with soil water; roots take it from the water through membrane transportersSchematic, not to scale
Schematic of cadmium pools in soil and the route into a root: exchangeable, organic-bound, oxide-sorbed and precipitated cadmium exchange with the dissolved pool, which roots take up through transporters; the Casparian strip blocks the cell-wall routeSoil around a root (not to scale)To shoot and the harvested partExchangeableCd²⁺ held on charged clay and organicsurfaces; cation exchange capacity setshow muchBound to organic matterCarboxylate groups hold Cd; moreorganic carbon, lower bean CdSorbed on Fe and Mn oxidesMore oxalate-extractable Mn, lower beanCd (Ecuador survey)PrecipitatedCdCO₃ forms near pH 7 in modelsystemsDissolved: the pool roots takeupCd²⁺ and Cd–organic complexes insoil water; Ca²⁺ competes foruptakeLower pHreleasesCd²⁺ fromthese poolsSoil pH45678More Cd dissolved and taken upMore Cd sorbed or precipitatedCd²⁺Ca²⁺H⁺Root cross-section12341Epidermis and root hair: surface for uptake2Cortex: water and ions move in cell walls or throughcells3Endodermis: the Casparian strip (red ring) blocks thecell-wall route, so ions must cross a membrane4Xylem: carries the element to the shoot and harvestedpartMembrane transporters: Cd²⁺ through manganeseroutes (rice NRAMP5); arsenite through silicontransporters (rice Lsi1, Lsi2)Cell-wall route, stopped at the endodermis
Soil pools and effects: Wade et al., PLoS One 2022; Argüello et al., Sci Total Environ 2019. Transporters: Sasaki et al., Plant Cell 2012 (NRAMP5); Ma et al., PNAS 2008 (Lsi1, Lsi2). Uptake pathways for lead and mercury are less understood (Clemens and Ma, Annu Rev Plant Biol 2016).
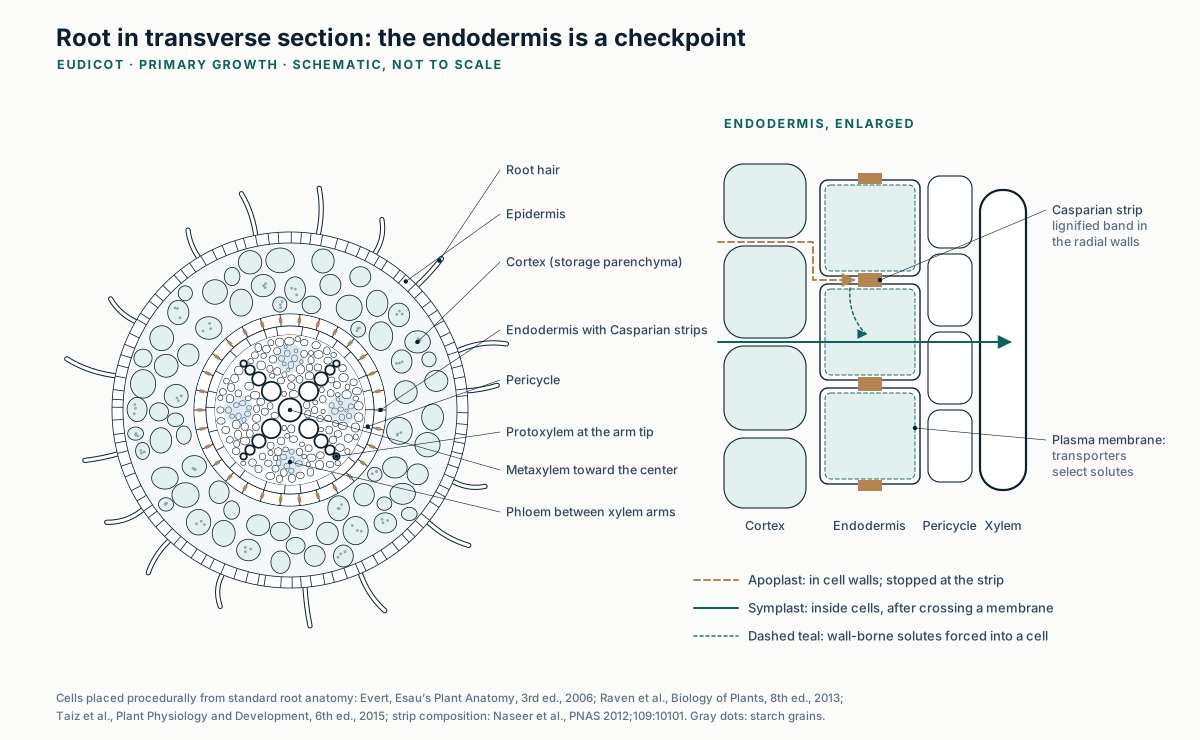
Dissolved ions can move through root cell walls only as far as the endodermis; to reach the xylem they must cross a cell membraneSchematic
Cross-section of a young eudicot root: epidermis with root hairs, a wide cortex, a ring of endodermis cells with Casparian strips in their side walls, the pericycle, and a central vascular cylinder in which xylem forms a four-armed star with phloem between the arms. An enlarged panel shows water and dissolved ions moving through cell walls until the Casparian strip blocks them, so they must pass through a cell membrane into the cytoplasm to reach the xylem.
Root anatomy: Evert RF, Esau’s Plant Anatomy, 3rd ed., Wiley 2006; Raven PH et al., Biology of Plants, 8th ed., 2013; Taiz L et al., Plant Physiology and Development, 6th ed., 2015; Naseer S et al., PNAS 2012;109:10101–10106. Not to scale. Generated illustration, EUTECNIQ. Full-size SVG
Text version of the soil and root schematic

Cadmium in soil occurs in exchangeable form on charged clay and organic surfaces, bound to carboxylate groups of organic matter, sorbed on iron and manganese oxides, and as precipitates such as cadmium carbonate, which forms near pH 7 in model systems. These pools exchange with cadmium dissolved in soil water as Cd²⁺ and organic complexes. Lower pH releases cadmium from the solid pools into solution. In the Ecuador cacao survey, bean cadmium rose with total soil cadmium and fell with soil pH, oxalate-extractable manganese and organic carbon. Calcium competes with cadmium for uptake.

At the root, ions cross the epidermis and cortex either in the cell walls or through cells. The Casparian strip of the endodermis blocks the cell-wall route, so the element must cross a membrane through a transporter. In rice, NRAMP5 carries manganese and cadmium into root cells, and the silicon transporters Lsi1 and Lsi2 carry arsenite. The xylem then carries the element to the shoot and the harvested part.

Bioconcentration factor (also called transfer factor)BCF = CplantCsoil both in mg/kg dry weight; BCF > 1 means the plant part is richer in the element than the soil
Explanation, details and sources

Soil cadmium is spread over pools held on clay, organic matter and iron or manganese oxides, in precipitates, and dissolved in soil water. Roots take it from the dissolved pool. In a synthesis of 31 cacao studies, total soil cadmium, soil pH and leaf cadmium best predicted bean cadmium; "available" cadmium from extraction tests had a negligible effect.

2 · Published data

In 672 published cacao observations, the median bean-to-soil cadmium ratio falls from 3.4 below pH 5 to 1.2 at pH 6.5–7.0

Cacao beans concentrate soil cadmium most on acidic soilsPublished dataset
Median bean-to-soil cadmium bioconcentration factor in cacao by soil-pH class, with interquartile ranges: 3.4 below pH 5, falling to 1.2 at pH 6.5 to 7.00.51248BCF = 1: bean and soilequal in concentrationWhole-bean Cd ÷ total soil Cd (log scale)pH < 5.0: median BCF 3.36, IQR 1.49–6.32, n = 1083.4< 5.0n = 108pH 5.0–5.5: median BCF 2.44, IQR 1.55–3.44, n = 1082.45.0–5.5n = 108pH 5.5–6.0: median BCF 2.00, IQR 1.06–2.98, n = 1352.05.5–6.0n = 135pH 6.0–6.5: median BCF 1.32, IQR 0.85–2.13, n = 1811.36.0–6.5n = 181pH 6.5–7.0: median BCF 1.20, IQR 0.70–1.92, n = 901.26.5–7.0n = 90pH ≥ 7.0: median BCF 1.54, IQR 1.12–2.42, n = 501.5≥ 7.0n = 50Soil pH classMedianMiddle 50% (IQR)672 paired soil and bean observations from7 studies; 566 from Ecuador
Data: Wade J, et al. PLoS One 2022;17(2):e0261989, dataset "Extracted and finalized data.csv" (GitHub, commit b16cd1d). Observations with soil pH, total soil Cd and whole-bean Cd; class medians and quartiles computed by EUTECNIQ.
Data table: BCF by soil-pH class
Cacao bean-to-soil cadmium bioconcentration factor by soil pH class
Soil pH classnBCF, 25th percentileBCF, medianBCF, 75th percentileMedian bean Cd, mg/kgMedian soil Cd, mg/kg
< 5.01081.493.366.320.750.30
5.0–5.51081.552.443.440.690.30
5.5–6.01351.062.002.980.460.30
6.0–6.51810.851.322.130.480.35
6.5–7.0900.701.201.920.610.56
≥ 7.0501.121.542.420.760.42

BCF = whole-bean Cd ÷ total soil Cd for each observation (the paper's definition). Percentiles by linear interpolation. 566 of the 672 observations come from Ecuador, from 7 studies in all. The paper reports, for all observations with both values, a median BCF of 1.8 and a mean of 2.5, with 77.0% above 1.

Bean cadmium rises with soil cadmium and falls with soil pHPublished dataset
Heat map of median whole-bean cadmium in cacao by total soil cadmium class and soil pH class; bean cadmium rises with soil cadmium and falls with pHSoil pH class →Soil Cd, mg/kg ↓< 5.05.0–5.55.5–6.06.0–6.56.5–7.0≥ 7.0< 0.2Soil Cd < 0.2 mg/kg, pH < 5.0: median bean Cd 0.43 mg/kg, n = 37, 32% above 0.600.43Soil Cd < 0.2 mg/kg, pH 5.0–5.5: median bean Cd 0.23 mg/kg, n = 23, 13% above 0.600.23Soil Cd < 0.2 mg/kg, pH 5.5–6.0: median bean Cd 0.29 mg/kg, n = 36, 14% above 0.600.29Soil Cd < 0.2 mg/kg, pH 6.0–6.5: median bean Cd 0.235 mg/kg, n = 26, 4% above 0.600.23Soil Cd < 0.2 mg/kg, pH 6.5–7.0: median bean Cd 0.22 mg/kg, n = 10, 20% above 0.600.22Soil Cd < 0.2 mg/kg, pH ≥ 7.0: median bean Cd 0.21 mg/kg, n = 6, 0% above 0.600.210.2–0.4Soil Cd 0.2–0.4 mg/kg, pH < 5.0: median bean Cd 0.99 mg/kg, n = 34, 62% above 0.600.99Soil Cd 0.2–0.4 mg/kg, pH 5.0–5.5: median bean Cd 0.63 mg/kg, n = 43, 51% above 0.600.63Soil Cd 0.2–0.4 mg/kg, pH 5.5–6.0: median bean Cd 0.43 mg/kg, n = 54, 31% above 0.600.43Soil Cd 0.2–0.4 mg/kg, pH 6.0–6.5: median bean Cd 0.33 mg/kg, n = 73, 23% above 0.600.33Soil Cd 0.2–0.4 mg/kg, pH 6.5–7.0: median bean Cd 0.305 mg/kg, n = 20, 30% above 0.600.30Soil Cd 0.2–0.4 mg/kg, pH ≥ 7.0: median bean Cd 0.5 mg/kg, n = 12, 42% above 0.600.500.4–0.8Soil Cd 0.4–0.8 mg/kg, pH < 5.0: median bean Cd 1.56 mg/kg, n = 23, 83% above 0.601.56Soil Cd 0.4–0.8 mg/kg, pH 5.0–5.5: median bean Cd 1.52 mg/kg, n = 33, 82% above 0.601.52Soil Cd 0.4–0.8 mg/kg, pH 5.5–6.0: median bean Cd 1.025 mg/kg, n = 36, 69% above 0.601.02Soil Cd 0.4–0.8 mg/kg, pH 6.0–6.5: median bean Cd 0.905 mg/kg, n = 50, 68% above 0.600.91Soil Cd 0.4–0.8 mg/kg, pH 6.5–7.0: median bean Cd 0.61 mg/kg, n = 33, 55% above 0.600.61Soil Cd 0.4–0.8 mg/kg, pH ≥ 7.0: median bean Cd 0.89 mg/kg, n = 26, 85% above 0.600.89≥ 0.8Soil Cd ≥ 0.8 mg/kg, pH < 5.0: median bean Cd 2.44 mg/kg, n = 14, 100% above 0.602.44Soil Cd ≥ 0.8 mg/kg, pH 5.0–5.5: median bean Cd 3.52 mg/kg, n = 9, 100% above 0.603.52Soil Cd ≥ 0.8 mg/kg, pH 5.5–6.0: median bean Cd 2.27 mg/kg, n = 9, 100% above 0.602.27Soil Cd ≥ 0.8 mg/kg, pH 6.0–6.5: median bean Cd 1.59 mg/kg, n = 32, 81% above 0.601.59Soil Cd ≥ 0.8 mg/kg, pH 6.5–7.0: median bean Cd 1.22 mg/kg, n = 27, 74% above 0.601.22Soil Cd ≥ 0.8 mg/kg, pH ≥ 7.0: median bean Cd 1.15 mg/kg, n = 6, 67% above 0.601.15n = 37n = 23n = 36n = 26n = 10n = 6n = 34n = 43n = 54n = 73n = 20n = 12n = 23n = 33n = 36n = 50n = 33n = 26n = 14n = 9n = 9n = 32n = 27n = 6Median whole-bean Cd, mg/kg0.22.6Median above 0.80 mg/kg, usedin the literature as aconservative bean threshold(EU limit for chocolate ≥ 50%cocoa solids)Cells show the median and the numberof observations; every cell has n ≥ 5.Class bounds are lower-inclusive.Computed by EUTECNIQ from the published dataset of Wade et al. (2022), 672 observations; whole bean = nib plus shell, asthe dataset reports it.
Data as above; cell medians computed by EUTECNIQ. EU limits: Commission Regulation (EU) 2023/915, Annex I, entries 3.2.15.3 and 3.2.15.4. The 0.80 mg/kg bean threshold is the convention Wade et al. describe; it is not a legal limit for beans.
Data table: median whole-bean Cd (mg/kg) and n by soil Cd and pH class
Median whole-bean cadmium by total soil cadmium class and soil pH class
Soil Cd, mg/kgpH < 5.05.0–5.55.5–6.06.0–6.56.5–7.0≥ 7.0
< 0.20.43 (37)0.23 (23)0.29 (36)0.23 (26)0.22 (10)0.21 (6)
0.2–0.40.99 (34)0.63 (43)0.43 (54)0.33 (73)0.30 (20)0.50 (12)
0.4–0.81.56 (23)1.52 (33)1.02 (36)0.91 (50)0.61 (33)0.89 (26)
≥ 0.82.44 (14)3.52 (9)2.27 (9)1.59 (32)1.22 (27)1.15 (6)

Number of observations in parentheses. Class bounds are lower-inclusive. Whole bean means nib plus shell, as the dataset records it.

Window statistics from the published datasetpH ± 0.5   soil Cd ÷ 1.5 to × 1.5
Observations, n101
Median bean Cd, mg/kg0.84
90th percentile, mg/kg2.12
Share above 0.60, %63
Share above 0.80, %52
Median BCF2.13

101 observations from 4 studies. 63% of beans in this window exceed 0.60 mg/kg.

Distribution of bean cadmium in the selected soil windowPublished dataset
Dashed line: 0.60 mg/kg (EU cocoa powder). Red line: 0.80 mg/kg (EU chocolate ≥ 50% cocoa solids; used as a bean threshold in the literature).
Method, assumptions and limits
What it shows
Statistics of published whole-bean cadmium measurements whose soil pH and total soil cadmium fall in the chosen window: count, median, 90th percentile, shares above 0.60 and 0.80 mg/kg, and median BCF.
Data
672 observations from the dataset published with Wade et al. (2022) that report soil pH, total soil Cd and whole-bean Cd above zero. Windows: pH centre ± 0.5; soil Cd centre ÷ 1.5 to × 1.5. Statistics are precomputed (numpy, linear-interpolation percentiles); no observations are shipped to the browser. Windows with fewer than 10 observations show no statistics.
Limits
566 observations are from Ecuador and some studies report means of several samples. Cultivar, plant age, sampling depth and laboratory method vary between studies. The EU limits apply to cocoa products, not to beans.
What it does not establish
It does not predict the cadmium in beans from any particular farm.
Verification
Window statistics are recomputed independently from the source CSV in tests/numerics/ref/academy_soil-and-cultivation.py.
References
Wade J, et al. PLoS One 2022;17(2):e0261989; Regulation (EU) 2023/915.
Explanation, details and sources

Wade and colleagues compiled soil and bean measurements from the literature and published the dataset. EUTECNIQ grouped its 672 paired observations by soil pH and soil cadmium. The authors' own model found that raising soil pH from 5 to 7, or soil organic carbon from 2% to above 3.5%, would halve the BCF.

How the numbers are measured. Total soil metal is measured after strong-acid digestion; "available" metal with salt or dilute-acid extractions, which in the cacao synthesis tracked total cadmium and explained little on their own. Most cacao studies sampled only the top 30 cm, although total cadmium rose about 200% below 25–35 cm, so surface samples may understate what deep roots reach. Plant tissue is dried, acid-digested and analyzed element by element.

3 · Transfer factors

Transfer factors differ between elements by orders of magnitude, and in one wolfberry survey cadmium's was about 340 times lead's

In one fruit, element BCFs span more than two orders of magnitudePeer-reviewed data
Bioconcentration factors of seven elements in wolfberry fruit, log scale: cadmium 5.82 and copper 1.76 above 1, lead 0.017 lowest0.010.1110BCF = 1Bioconcentration factor, fruit ÷ root soil (log scale)Cadmium (Cd)Cadmium: BCF 5.825.82Copper (Cu)Copper: BCF 1.761.76Zinc (Zn)Zinc: BCF 0.4750.475Chromium (Cr)Chromium: BCF 0.0560.056Arsenic (As)Arsenic: BCF 0.0260.026Nickel (Ni)Nickel: BCF 0.0230.023Lead (Pb)Lead: BCF 0.0170.017Cadmium ÷ lead≈ 340-foldSame fruit, same 37 sites, samesoils (Ningxia, China; 185samples, June 2020)USP <2232> elementOther element
Zhou T, et al. Int J Environ Res Public Health 2022;19(23):16186, Table 2 (185 fruit and soil samples, 37 sites, June 2020). Mercury was not detected in the fruit.
Data table: wolfberry BCF by element
Bioconcentration factors in wolfberry fruit
ElementMean fruit, mg/kgMean soil, mg/kgBCF (Table 2)
Cadmium0.1000.02605.82
Copper8.705.271.76
Zinc19.642.50.475
Chromium2.6252.90.0560
Arsenic0.2008.360.0260
Nickel0.88041.00.0230
Lead0.35023.00.0170

The paper defines BCF = Cfruit ÷ Csoil (its Equation 1). Its reported BCFs differ from the ratio of the two means, which suggests they were averaged per sample; we reproduce Table 2 as published.

Generic soil-to-plant regressions (U.S. EPA Eco-SSL, Table 4a)ln Cp = b0 + b1 ln Cs Cd: b1 = 0.546, b0 = −0.475 Pb: 0.561, −1.328 As: Cp = 0.03752 Cs

Because b1 < 1, the BCF falls as soil concentration rises: for cadmium it is 0.62 at 1 mg/kg and 0.22 at 10 mg/kg. U.S. EPA, Guidance for Developing Ecological Soil Screening Levels, Attachment 4-1 (revised April 2007), from Bechtel Jacobs (1998).

Explanation, details and sources

Zhou and colleagues sampled wolfberry (Lycium barbarum) fruit and root-zone soil at 37 sites in Ningxia, China. Cadmium and copper had BCFs above 1; lead had the lowest, 0.017. With a BCF that low, a high lead result in a botanical calls for a look at contamination after harvest.

4 · Documented cases

Documented contamination traces back to soil, water, processing or deliberate addition, and each route needs its own control

Two routes into a botanical, and the controls that act on eachSchematic; cases cited below
Two routes bring toxic elements into a botanical: uptake from soil and water into plant tissue, and contamination added on the surface or by people after harvest; each route has its own controls, and the finished material is tested element by elementTaken up from soil or waterAdded on the surface or by peopleParent materialYoung soils, not yet depleted of Cd byweathering, carry natural Cd (Ecuador cacaosurvey)Fertilizers and amendmentsThe EU sets Cd limits for phosphate fertilisersand requires their reviewIrrigation and floodingFlooded paddy soil holds arsenite; rice takes it upthrough silicon transportersIndustry and trafficWolfberry soils, Ningxia: 27.8% industrial and9.5% transport sources by factor analysisAdhering soil and dustTurmeric polishing-mill soil reached 4,257 µg/glead (Bangladesh)Deliberate additionLead chromate pigment in turmeric; metals addedby design in rasa shastra medicinesUptake into plant tissueScales with soil concentration × BCF; pH,organic matter and cultivar change theBCFBefore harvestSite history and soil tests; pH andamendments; low-uptake cultivars orrootstocks; irrigation water qualityContamination of the harvestedmaterialNo BCF applies; the level follows thecontamination, not the soilAt and after harvestRemove adhering soil (WHO GACP); dustcontrol in milling; qualify suppliers; testeach elementcontrolled bycontrolled byDried botanical, extract or finishedsupplementBoth routes end in the same material, and atotal-element result alone does not showwhich route the metal took. Arsenic,cadmium, lead and mercury are measuredelement by element (USP <233>), and thedaily dose is compared with USP <2232>.Uptake routeCplant​ = BCF × Csoil​Daily exposureE = Cingredient​ × mdaily​ ≤ PDEDocumented cases on this pageAyurvedic products sold online: 20.7% withdetectable Pb, Hg or As (2008)Turmeric colored with lead chromate,Bangladesh (2019)Cinnamon in applesauce pouches: 566reported cases with blood lead ≥ 3.5 µg/dL(2023–2024)Peeled cacao beans from 560 Ecuadorianfarms: 45% above 0.60 mg/kg Cd (2019)
Argüello et al. 2019; Regulation (EU) 2019/1009, Article 49(b); Ma et al. 2008; Zhou et al. 2022; Forsyth et al., Environ Res 2019; Saper et al., JAMA 2008; Troeschel et al., MMWR 2025; WHO GACP (2003), § 2.4; USP ⟨233⟩ and ⟨2232⟩.
One in five Ayurvedic products bought online contained lead, mercury or arsenic; two in five rasa shastra products didPeer-reviewed data
Share of Ayurvedic products bought online that contained detectable lead, mercury or arsenic: 20.7% overall, 40.6% of rasa shastra products and 17.1% of others0%10%20%30%40%50%All 193 productsAll 193 products: 20.7% (95% CI 15.2–27.1%)20.7%Made in the United StatesMade in the United States: 21.7% (95% CI 14.6–30.4%)21.7%Made in IndiaMade in India: 19.5% (95% CI 11.3–30.1%)19.5%Rasa shastra productsRasa shastra products: 40.6%40.6%Non-rasa shastra productsNon-rasa shastra products: 17.1%17.1%Products with detectable Pb, Hg or As (XRF); whiskers: 95% CIRasa shastra vs other productsMedian lead11.5 vs 7.0 µg/gMedian mercury20,800 vs 34.5 µg/gPrevalence of metals40.6% vs 17.1% (P = .007)Of the metal-containing products, 75%claimed GMP and 95% were sold by U.S.websites
Saper RB, et al. JAMA 2008;300(8):915–923 (abstract). 230 products ordered August–October 2005 from 25 websites; 193 received and analyzed by x-ray fluorescence.
Data table: Saper et al. (2008)
Prevalence of detectable lead, mercury or arsenic in Ayurvedic medicines sold online
GroupProducts with metals, %95% CI, %
All products (n = 193)20.715.2–27.1
U.S.-manufactured21.714.6–30.4
Indian-manufactured19.511.3–30.1
Rasa shastra40.6not given in abstract
Non-rasa shastra17.1not given in abstract

US vs Indian: P = .86. Rasa shastra vs others: P = .007. Median lead 11.5 vs 7.0 µg/g (P = .03); median mercury 20,800 vs 34.5 µg/g (P = .04). Of metal-containing products, 95% were sold by U.S. websites and 75% claimed Good Manufacturing Practices; all exceeded one or more standards for acceptable daily intake of toxic metals.

Explanation, details and sources

Uptake follows soil chemistry. Contamination added on or after harvest follows people and processes, and no BCF predicts it. The route decides the control: a soil problem is managed by choosing and treating fields, an adulteration problem by testing lots and qualifying suppliers.

Documented contamination cases, what was found and the route
CaseWhat was foundRouteSource
Ayurvedic medicines sold online20.7% of 193 products had detectable Pb, Hg or As; rasa shastra combines herbs with metals, minerals and gemsDeliberate addition in rasa shastra; not determined for the othersSaper et al., JAMA 2008
Turmeric, BangladeshLead chromate pigment in 7 of 9 major producing districts; turmeric powder up to 1,152 µg/g Pb; pigments 2–10% Pb by weightDeliberate addition; mill dustForsyth et al., Environ Res 2019
Cinnamon in applesauce pouches, U.S.FDA identified lead in the cinnamon as the source; 566 cases (blood lead ≥ 3.5 µg/dL) in 44 states, DC and Puerto Rico, Nov 2023–Apr 2024; 55% in children under 2Contaminated ingredientTroeschel et al., MMWR 2025
Cacao beans, Ecuador560 farms; mean peeled-bean Cd 0.90 mg/kg, 45% of samples above 0.60; mean soil Cd 0.44 mg/kg, typical of young unpolluted soilsUptake from naturally Cd-bearing soilArgüello et al., Sci Total Environ 2019
Rice and arsenicArsenite, the main form in paddy soil, enters rice roots through silicon transporters; FDA's action level for infant rice cereal is 100 µg/kg inorganic arsenic, met by 76% of 2018 samplesUptake from flooded soilMa et al., PNAS 2008; FDA guidance, Aug 2020
5 · Limits

Food limits are set per kilogram of food; a supplement ingredient answers to the daily-intake limits of USP ⟨2232⟩

Published limits for the four USP ⟨2232⟩ elements span 0.1 to 3 mg/kgPrimary sources
Published concentration limits for cadmium, lead, inorganic arsenic and mercury on a log scale from 0.1 to 3 mg/kg, by authorityEU Regulation 2023/915, food as soldFDA action level (guidance)USP <2232> component limit, 10 g/day basis0.050.10.20.5125Limit, mg/kg (= µg/g), log scaleCadmiumCadmium: EU milk chocolate < 30%, 0.1 mg/kg0.1 · EU milk chocolate < 30%Cadmium: EU rice, 0.15 mg/kg0.15 · EU riceCadmium: EU chocolate < 50%, 0.3 mg/kg0.3 · EU chocolate < 50%Cadmium: USP component, 0.5 mg/kg0.5 · USP componentCadmium: EU cocoa powder, 0.6 mg/kg0.6 · EU cocoa powderCadmium: EU chocolate ≥ 50%, 0.8 mg/kg0.8 · EU chocolate ≥ 50%LeadLead: USP component, 0.5 mg/kg0.5 · USP componentLead: EU food supplements, 3 mg/kg3 · EU food supplementsInorganic arsenicInorganic arsenic: FDA infant rice cereal action level, 0.1 mg/kg0.1 · FDA infant rice cereal action levelInorganic arsenic: USP component, 1.5 mg/kg1.5 · USP componentMercuryMercury: USP methylmercury, 0.2 mg/kg0.2 · USP methylmercuryMercury: USP total mercury, 1.5 mg/kg1.5 · USP total mercury
Commission Regulation (EU) 2023/915 of 25 April 2023, Annex I, entries 3.1.28, 3.2.12.3 and 3.2.15.1–3.2.15.4; FDA, Action Level for Inorganic Arsenic in Rice Cereals for Infants (August 2020); USP ⟨2232⟩ Table 2 as published in USP 38–NF 33 (confirm current values in USP–NF).
Data table: limits shown in the figure
Concentration limits for cadmium, lead, inorganic arsenic and mercury
ElementProductLimit, mg/kgInstrument
CadmiumMilk chocolate, < 30% total dry cocoa solids0.10EU 2023/915, 3.2.15.1
CadmiumRice (also quinoa, wheat bran, wheat gluten)0.15EU 2023/915, 3.2.12.3
CadmiumChocolate < 50% total dry cocoa solids; milk chocolate ≥ 30%0.30EU 2023/915, 3.2.15.2
CadmiumCocoa powder sold to the final consumer0.60EU 2023/915, 3.2.15.4
CadmiumChocolate ≥ 50% total dry cocoa solids0.80EU 2023/915, 3.2.15.3
LeadFood supplements3.0EU 2023/915, 3.1.28
Inorganic arsenicInfant rice cereal (action level, 100 µg/kg)0.10FDA guidance, August 2020
Cd, Pb / inorganic As, total Hg / methylmercurySupplement component, 10 g/day basis0.5 / 1.5 / 0.2USP ⟨2232⟩ Table 2
Explanation, details and sources

The EU caps cadmium in chocolate at 0.10–0.80 mg/kg by cocoa-solids content and lead in food supplements at 3.0 mg/kg. USP ⟨2232⟩ caps the daily exposure from a supplement, 5 µg/day for lead or cadmium, and derives component limits by assuming 10 g/day. The USP, ICH and COA page has the full table and the Proposition 65 comparison.

6 · Calculator
Soil-to-dose chainE = Cs × BCF × DER × f × m   ≤ PDE
Plant, µg/g dry0.426
Effective BCF0.852
Ingredient, µg/g2.13
Daily exposure, µg/day2.13
Share of USP PDE, %42.6
Share of Prop 65 lead MADL, %lead only
Highest soil level at the PDE, mg/kg2.39

Within the USP ⟨2232⟩ PDE for cadmium (5 µg/day).

From soil to daily dose on one log scaleCalculator; values you set
Bars start at 0.001. Red line: USP ⟨2232⟩ PDE. Dashed line on the ingredient: USP component limit (10 g/day basis), shown for scale. For lead, the gray dashed line on the daily exposure is the Proposition 65 MADL (0.5 µg/day).
Method, assumptions and limits
What it calculates
Plant concentration from soil concentration, the ingredient concentration after extraction, the daily exposure, its share of the USP ⟨2232⟩ PDE and, for lead, of California's Proposition 65 MADL, and the soil concentration at which exposure equals the PDE.
Equations
EPA mode: ln Cp = b0 + b1 ln Cs (Cd: 0.546, −0.475; Pb: 0.561, −1.328); As: Cp = 0.03752 Cs. Constant mode: Cp = BCF × Cs. Ci = Cp × DER × f. E = Ci × m. Cs,max solves E = PDE.
Variables and units
Cs: mg/kg dry soil, 0.05–500. Cp, Ci: µg/g (= mg/kg) dry. BCF: 0.005–10. DER: native drug-to-extract ratio, the mass of herbal substance per mass of genuine extract (EMA), 1 for powdered whole herb. f: 0–100%. m: 0.1–10 g/day. PDE (µg/day): As 15, Cd 5, Pb 5, Hg 15.
Assumptions
f = 100% is the conservative case: every microgram in the plant ends up in the extract. Soil adhering to roots and contamination after harvest are not modeled. Total arsenic is treated as inorganic, as ⟨2232⟩ allows for a nonspeciation result. EPA's table gives no plant model for mercury, so mercury always uses the BCF you set.
Valid range
The EPA regressions are generic models for above-ground plant tissue across species. Efroymson et al. (2001) fitted similar soil-to-plant regressions to published field data from contaminated soils and recommend their upper 95% prediction limits for screening. Element, species, plant part and soil pH move the real BCF over orders of magnitude (sections 2 and 3).
What it does not establish
It does not predict a specific lot, replace testing of the finished material, or decide Proposition 65 warnings. It does not include intake from other foods.
Verification
Six cases are checked against an independent Python implementation (tests/numerics/ref/academy_soil-and-cultivation.py), including the EPA benchmark Cp = e−0.475 = 0.622 µg/g at 1 mg/kg cadmium.
References
U.S. EPA Eco-SSL Attachment 4-1 (2007), Table 4a; Efroymson et al., Environ Toxicol Chem 2001; EMA/HMPC/CHMP/CVMP/287539/2005 Rev.1; USP ⟨2232⟩; OEHHA, Proposition 65, lead.

Six common misreadings

  • A BCF≠a constant of the plant; it moves with soil pH, organic carbon, soil concentration and cultivar
  • "Available" soil metal≠what the plant takes up; in cacao it added little beyond total cadmium
  • Low soil metal≠a clean botanical; dust, adhering soil and adulteration bypass uptake
  • The EU limit for cocoa powder≠a legal limit for cacao beans
  • A USP component limit≠the PDE; it assumes 10 g/day, so it is stricter than needed below that dose and too loose above it
  • Percent of an essential oil≠milligrams per gram of plant; a rising share can hide a falling total
Explanation, details and sources

Multiply soil concentration by uptake, the extract's concentration factor, the share of the element that follows the extract, and the daily intake. Run backward, the same chain gives the highest soil concentration a sourcing region can have for a given product.

Worked example. Ecuador's mean total soil cadmium, 0.44 mg/kg, times the cacao median BCF of 1.8 gives 0.79 mg/kg, close to the survey's mean of 0.90 mg/kg in peeled beans; the two studies measured different bean fractions, so the agreement is approximate. An ingredient at 0.79 µg/g taken at 10 g/day would deliver 7.9 µg/day, above the 5 µg/day cadmium PDE.

7 · Harvest timing

Harvest month changed essential-oil content more than threefold within one season of cultivated aromatic crops

Each crop has its own peak month, and flowers can hold more oil than leavesPeer-reviewed data
Heat map of essential-oil content in mL per 100 g dry weight by harvest month for six cultivated aromatic crops in Greece; peppermint rose from 1.01 in April to 3.22 in July while field oregano fell from 3.75 to 1.42AprilMayJuneJulyJuly,inflorescencesPeppermint (M. × piperita)Peppermint (M. × piperita) · April: 1.01 mL/100 g1.01Peppermint (M. × piperita) · May: 1.55 mL/100 g1.55Peppermint (M. × piperita) · June: 2.32 mL/100 g2.32Peppermint (M. × piperita) · July: 3.22 mL/100 g3.22Peppermint (M. × piperita) · July, inflorescences: not samplednot sampledSpearmint (M. spicata)Spearmint (M. spicata) · April: 1.63 mL/100 g1.63Spearmint (M. spicata) · May: 2.45 mL/100 g2.45Spearmint (M. spicata) · June: 3.16 mL/100 g3.16Spearmint (M. spicata) · July: 3.68 mL/100 g3.68Spearmint (M. spicata) · July, inflorescences: 5.40 mL/100 g5.40Rosemary (S. rosmarinus)Rosemary (S. rosmarinus) · April: 1.76 mL/100 g1.76Rosemary (S. rosmarinus) · May: 2.04 mL/100 g2.04Rosemary (S. rosmarinus) · June: 3.52 mL/100 g3.52Rosemary (S. rosmarinus) · July: 2.13 mL/100 g2.13Rosemary (S. rosmarinus) · July, inflorescences: 3.09 mL/100 g3.09Sage (S. officinalis)Sage (S. officinalis) · April: 1.29 mL/100 g1.29Sage (S. officinalis) · May: 1.16 mL/100 g1.16Sage (S. officinalis) · June: 1.39 mL/100 g1.39Sage (S. officinalis) · July: 2.65 mL/100 g2.65Sage (S. officinalis) · July, inflorescences: 1.66 mL/100 g1.66Oregano, field (O. vulgare subsp. hirtum)Oregano, field (O. vulgare subsp. hirtum) · April: 3.75 mL/100 g3.75Oregano, field (O. vulgare subsp. hirtum) · May: 3.31 mL/100 g3.31Oregano, field (O. vulgare subsp. hirtum) · June: 3.03 mL/100 g3.03Oregano, field (O. vulgare subsp. hirtum) · July: 1.42 mL/100 g1.42Oregano, field (O. vulgare subsp. hirtum) · July, inflorescences: 6.89 mL/100 g6.89Oregano, greenhouseOregano, greenhouse · April: 3.73 mL/100 g3.73Oregano, greenhouse · May: 3.27 mL/100 g3.27Oregano, greenhouse · June: 2.21 mL/100 g2.21Oregano, greenhouse · July: 2.60 mL/100 g2.60Oregano, greenhouse · July, inflorescences: 5.93 mL/100 g5.93Oil content, mL per 100 g dryweight17Highest leaf month forthat cropLeaves and flowers dried 10days in the dark at 25 °C, thenhydrodistilledThessaloniki, Greece, one season: planted in October, harvested monthly April to July. Right of the rule: inflorescences in July.
Stefanakis MK, et al. Seasonal variation of aromatic plants under cultivation conditions. Plants 2022;11(16):2083, Tables 1–6. Clevenger hydrodistillation; content per 100 g dry plant material.
Data table: essential-oil content, mL/100 g dry weight
Essential-oil content by harvest month
CropAprilMayJuneJulyJuly, inflorescences
Peppermint (Mentha × piperita)1.011.552.323.22not sampled
Spearmint (Mentha spicata)1.632.453.163.685.40
Rosemary (Salvia rosmarinus)1.762.043.522.133.09
Sage (Salvia officinalis)1.291.161.392.651.66
Oregano, field (Origanum vulgare subsp. hirtum)3.753.313.031.426.89
Oregano, greenhouse3.733.272.212.605.93

April to July columns are leaves. Plants were set out in October at Thessaloniki, Greece, and dried in the dark at 25 °C for 10 days before distillation.

The main constituents shifted month to month in the same plantsPeer-reviewed data
Main essential-oil constituents by harvest month in four crops: spearmint carvone rose from 54.6 to 65.3 percent; peppermint linalyl acetate fell from 32.8 to 15.3 percentSpearmint40506070AprMayJunJulSpearmint, Carvone: April 54.6%, May 57.1%, June 64.1%, July 65.3%Spearmint, Carvone, April: 54.6%Spearmint, Carvone, May: 57.1%Spearmint, Carvone, June: 64.1%Spearmint, Carvone, July: 65.3%Carvone% of oil, leavesPeppermint0204060AprMayJunJulPeppermint, Linalool: April 39.1%, May 46.2%, June 61.1%, July 59.8%Peppermint, Linalool, April: 39.1%Peppermint, Linalool, May: 46.2%Peppermint, Linalool, June: 61.1%Peppermint, Linalool, July: 59.8%Peppermint, Linalyl acetate: April 32.8%, May 25.0%, June 20.5%, July 15.3%Peppermint, Linalyl acetate, April: 32.8%Peppermint, Linalyl acetate, May: 25.0%Peppermint, Linalyl acetate, June: 20.5%Peppermint, Linalyl acetate, July: 15.3%LinaloolLinalylacetateSage010203040AprMayJunJulSage, α-Thujone: April 28.4%, May 31.6%, June 23.0%, July 24.8%Sage, α-Thujone, April: 28.4%Sage, α-Thujone, May: 31.6%Sage, α-Thujone, June: 23.0%Sage, α-Thujone, July: 24.8%Sage, Camphor: April 16.5%, May 14.3%, June 13.2%, July 25.8%Sage, Camphor, April: 16.5%Sage, Camphor, May: 14.3%Sage, Camphor, June: 13.2%Sage, Camphor, July: 25.8%α-ThujoneCamphorRosemary0204060AprMayJunJulRosemary, Camphor: April 47.5%, May 29.8%, June 50.4%, July 52.6%Rosemary, Camphor, April: 47.5%Rosemary, Camphor, May: 29.8%Rosemary, Camphor, June: 50.4%Rosemary, Camphor, July: 52.6%Rosemary, Borneol: April 8.6%, May 4.4%, June 17.1%, July 7.1%Rosemary, Borneol, April: 8.6%Rosemary, Borneol, May: 4.4%Rosemary, Borneol, June: 17.1%Rosemary, Borneol, July: 7.1%CamphorBorneol
Stefanakis et al. 2022, Tables 1–4 (leaves; % of identified oil by GC–MS).
Data table: main constituents, % of oil
Main essential-oil constituents by month
Crop and constituentAprilMayJuneJuly
Spearmint, carvone54.657.164.165.3
Peppermint, linalool39.146.261.159.8
Peppermint, linalyl acetate32.825.020.515.3
Sage, α-thujone28.431.623.024.8
Sage, camphor16.514.313.225.8
Rosemary, camphor47.529.850.452.6
Rosemary, borneol8.64.417.17.1
Peak content depends on the compound, the organ, the germplasm and the plant's agePeer-reviewed findings
Where in the plant's life the measured content of four constituents was highest or lowest: artemisinin, hypericin, ginsenosides by root age and cacao bean cadmium by orchard ageAerial parts, by developmental stageVegetativeBudFloweringFruit ripeningArtemisininHypericinArtemisinin: Peaked in vegetative plants, late August to early September. Brazilian, Chinese and Swiss field lines (2018)Peaked in vegetative plants, late August toearly SeptemberBrazilian, Chinese and Swiss field lines (2018)Artemisinin: Highest at anthesis; flowers 4–11 × leaves. One clone, greenhouse and field (1995)Highest at anthesis; flowers 4–11 × leavesOne clone, greenhouse and field (1995)Highest during blossoming, lowest during fruit ripeningFour wild Hypericum species, Crete (2007)Hypericin highesthighestHypericin lowestlowestPerennial roots and trees, by ageGinsenosides Rg1 and RePanax ginseng roots aged 3 to 6 years from three regions: both rose withroot age; Rb1 in 6-year roots varied about twofold between regionsRoot age 3 → 6 yearsCadmium in cacao beansEcuador, 560 farms: bean Cd was 1.4 times lower in 40-year-old than in4-year-old orchardsOrchard age 4 → 40 yearsHighest measuredLowest measuredDirection of increasing age
Ferreira JFS, Simon JE, Janick J. Planta Med 1995;61(2):167–170; Ferreira JFS, et al. Front Plant Sci 2018;9:1096; Xenophontos M, et al. Planta Med 2007;73(12):1309–1315; Xiao D, et al. J Ginseng Res 2015;39(4):338–344; Argüello D, et al. Sci Total Environ 2019;649:120–127.
Text version of the timing figure

Artemisinin in one Artemisia annua clone was highest at anthesis, and 4 to 11 times higher in inflorescences than in leaves (1995). In elite Brazilian, Chinese and Swiss field germplasm it peaked in vegetative plants from late August to early September, up to 0.9% (2018). Hypericin in four wild Hypericum species on Crete was highest during blossoming and lowest during fruit ripening. In Panax ginseng roots aged 3 to 6 years from three regions, ginsenosides Rg1 and Re rose with age, and Rb1 in 6-year roots varied about twofold between regions. In Ecuador, bean cadmium was 1.4 times lower in 40-year-old than in 4-year-old cacao orchards.

Explanation, details and sources

Stefanakis and colleagues harvested five Lamiaceae species monthly from April to July in northern Greece. Peppermint oil rose from 1.01 to 3.22 mL/100 g dry weight; field oregano fell from 3.75 to 1.42. Composition moved as well: spearmint's carvone rose from 54.6% to 65.3% of the oil.

For a standardized ingredient, the month changes both how much marker a hectare yields and the ratio between constituents, so a specification built on one month's lots can fail on another's. Other constituents peak at different stages, and studies do not always agree on when. WHO's GACP guideline asks that harvest time follow "the quality and quantity of biologically active constituents rather than the total vegetative yield".

8 · Drying

Drying shifts an essential oil toward its less volatile constituents, and at 60 °C one Ocimum species lost 48% of its oil
The monoterpene hydrocarbons fell with each drying stepPeer-reviewed data
Oregano essential-oil composition fresh, after shade drying and after oven drying at 50 degrees C: monoterpene hydrocarbons fell, carvacrol rose from 67.8 to 76.1 percentMonoterpene hydrocarbons05101520FreshShade, 5 daysOven 50 °C,24 hp-Cymene: Fresh 17.7%, Shade, 5 days 14.1%, Oven 50 °C, 24 h 10.2%p-Cymene, Fresh: 17.7%p-Cymene, Shade, 5 days: 14.1%p-Cymene, Oven 50 °C, 24 h: 10.2%γ-Terpinene: Fresh 5.8%, Shade, 5 days 2.8%, Oven 50 °C, 24 h 1.1%γ-Terpinene, Fresh: 5.8%γ-Terpinene, Shade, 5 days: 2.8%γ-Terpinene, Oven 50 °C, 24 h: 1.1%α-Pinene: Fresh 2.1%, Shade, 5 days 1.4%, Oven 50 °C, 24 h 0.5%α-Pinene, Fresh: 2.1%α-Pinene, Shade, 5 days: 1.4%α-Pinene, Oven 50 °C, 24 h: 0.5%α-Pinene 0.5%γ-Terpinene 1.1%p-Cymene 10.2%% of oil, aerial partsPhenol6065707580FreshShade, 5 daysOven 50 °C,24 hCarvacrol: Fresh 67.8%, Shade, 5 days 73.9%, Oven 50 °C, 24 h 76.1%Carvacrol, Fresh: 67.8%Carvacrol, Shade, 5 days: 73.9%Carvacrol, Oven 50 °C, 24 h: 76.1%Carvacrol 76.1%Ocimum gratissimum leaves−48%oil content after oven drying at60 °C; no significant differenceat 30, 40 and 50 °CLeaves dried at 60 °C showeddamaged glandular trichomes
Caputo L, et al. Sci Rep 2022;12:3845, Tables 1 and 2 (oregano aerial parts, Salerno, July 2020; GC–MS, % of oil). Santana ACM, et al. Rev Bras Farmacogn 2014;24(5):524–530 (forced-air oven, 30–60 °C). WHO GACP (2003), § 4.1.3.
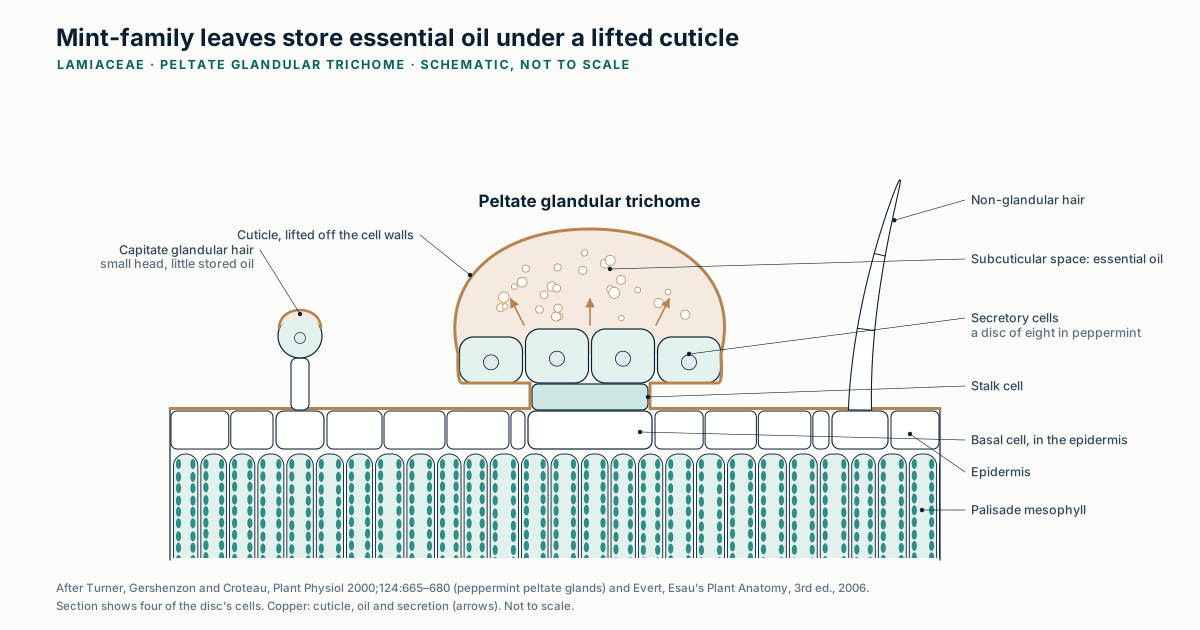
In mint-family leaves the essential oil collects in surface glands, under a lifted cuticle and outside the living cellsSchematic
Longitudinal section through a leaf surface showing three hair types on the epidermis. In the center, a peltate glandular trichome: a basal cell, a short stalk cell and a disc of secretory cells, over which the cuticle has lifted to form a dome-shaped space filled with essential oil. To the left, a smaller capitate glandular hair with a stalk and a one-celled head; to the right, a non-glandular hair of several cells. Palisade mesophyll lies below.
Turner GW, Gershenzon J, Croteau RB. Plant Physiol 2000;124:665–680 (peppermint peltate glands); Evert RF, Esau’s Plant Anatomy, 3rd ed., Wiley 2006. Not to scale. Generated illustration, EUTECNIQ. Full-size SVG
Data table: oregano oil composition by drying method, % of oil
Oregano essential-oil constituents fresh and after drying
ConstituentFreshShade, 5 daysOven 50 °C, 24 h
p-Cymene17.714.110.2
γ-Terpinene5.82.81.1
α-Pinene2.11.40.5
Carvacrol67.873.976.1

Percentages are shares of the oil, not amounts per gram of plant. The same study also tested microwave and osmotic treatments, not shown. For Ocimum gratissimum, Santana et al. found no significant difference in oil content after drying at 30, 40 and 50 °C and a 48% reduction at 60 °C, with damaged glandular trichomes.

Explanation, details and sources

In oregano, shade drying and 50 °C oven drying lowered the share of p-cymene, γ-terpinene and α-pinene and raised carvacrol's. WHO GACP recommends lower temperatures for plants rich in volatile substances, recorded drying conditions, and direct-fire heat kept below 60 °C.

9 · Good practice

WHO's 2003 GACP guideline places the controls for metals, identity and chemistry before the first laboratory test

Seven GACP control points and the hazards each addressesWHO guideline
WHO good agricultural and collection practices, 2003: seven control points from identity to records, each tagged with the hazards it addressesIdentity§ 2.1–2.2Site§ 2.3.1Cultivation§ 2.3.3–2.3.5Harvest§ 2.4Drying§ 4.1.3Packing andstorage§ 4.2–4.3Records andaudits§ 4.5–4.6Verify and recordthe scientific nameand cultivar orchemotype; seedsuppliers stateidentity andbreeding historyIdentitySame speciesdiffers by site;avoid soil, air orwater polluted byhazardouschemicals; checkpast land useContaminantsConstituentsDay length, rainand temperatureshapeconstituents;irrigation watermeets standards;no human excretaas fertilizerConstituentsContaminantsMicrobesTime it byconstituent qualityand quantity, nottotal yield; avoidsoil contact;remove soil fromrootsConstituentsContaminantsMicrobesKeep moisture low;lowertemperatures forvolatile-rich plants;record conditions;direct-fire heatbelow 60 °CConstituentsMicrobesLabel scientificname, plant part,origin, date andbatch; freshmaterial at 2–8 °CIdentityDocument everystep, includingextreme weatheror exposure tohazardoussubstances; auditsitesIdentityContaminantsConstituentsToxic elements and residuesIdentity and traceabilityConstituent profileMicrobial loadWHO GACP control points from identity to records, each tagged with the hazards it addressesIdentity · § 2.1–2.2Verify and record the scientific name and cultivar orchemotype; seed suppliers state identity and breedinghistoryIdentity and traceabilitySite · § 2.3.1Same species differs by site; avoid soil, air or waterpolluted by hazardous chemicals; check past land useToxic elements and residuesConstituent profileCultivation · § 2.3.3–2.3.5Day length, rain and temperature shape constituents;irrigation water meets standards; no human excreta asfertilizerConstituent profileToxic elements and residuesMicrobial loadHarvest · § 2.4Time it by constituent quality and quantity, not total yield;avoid soil contact; remove soil from rootsConstituent profileToxic elements and residuesMicrobial loadDrying · § 4.1.3Keep moisture low; lower temperatures for volatile-richplants; record conditions; direct-fire heat below 60 °CConstituent profileMicrobial loadPacking and storage · § 4.2–4.3Label scientific name, plant part, origin, date and batch;fresh material at 2–8 °CIdentity and traceabilityRecords and audits · § 4.5–4.6Document every step, including extreme weather orexposure to hazardous substances; audit sitesIdentity and traceabilityToxic elements and residuesConstituent profile
WHO guidelines on good agricultural and collection practices (GACP) for medicinal plants. Geneva: WHO; 2003 (ISBN 92 4 154627 1), sections as marked. Hazard tags summarize the text of each section. 21 CFR 111.70(b)(3) and 111.75(a)(1)(i).
Text version of the GACP figure
  1. Identity (§ 2.1–2.2). Verify and record the scientific name and, where relevant, cultivar, ecotype or chemotype. Seed suppliers should state identity, quality and breeding history.
  2. Site (§ 2.3.1). The same species can differ in quality between sites. Avoid contamination from soil, air or water polluted by hazardous chemicals, and evaluate past land use, previous crops and plant-protection products.
  3. Cultivation (§ 2.3.3–2.3.5). Day length, rainfall and temperature influence the plant's chemistry. Irrigation water should meet quality standards. Human excreta must not be used as fertilizer.
  4. Harvest (§ 2.4). Time the harvest by constituent quality and quantity; avoid soil contact; remove adhering soil from roots as soon as they are harvested.
  5. Drying (§ 4.1.3). Keep moisture low; use lower temperatures for material with volatile substances; record conditions; keep direct-fire heat below 60 °C.
  6. Packaging and storage (§ 4.2–4.3). Labels give the scientific name, plant part, origin, date and batch number; fresh material ideally at 2–8 °C.
  7. Records and audits (§ 4.5–4.6). Document all steps, including extreme weather and exposure to hazardous substances; audits by producers, buyers and authorities.
Explanation, details and sources

The guideline is international guidance, not U.S. law. In the United States, 21 CFR Part 111 binds the supplement manufacturer, which must test each dietary ingredient's identity and set limits on contaminants; GACP records are one source of evidence a manufacturer can use when it qualifies a supplier.

10 · Wild collection

Wild collection adds permits and conservation rules, and American ginseng roots are CITES Appendix II whether wild or cultivated

Five questions for wild-collected or protected materialRegulation and treaty
Five questions for wild-collected or protected botanicals, each with the consequence of answering yesQuestionConsequence1Collected from the wild?Plants taken from wild populationsPermits firstCollection permits from authorities and landowners; national redlists respected (WHO GACP § 3.1)YesGuideline2Is the species in a CITES Appendix?Check the listing and its annotationExport permit neededInternational trade only with an export permit or re-exportcertificate (CITES)Appendix IITreaty3Is it American ginseng (Panax quinquefolius)?50 CFR 23.68(a)Roots are listedWhole, sliced and parts of roots are Appendix II, wild orpropagated; powders, extracts, teas and other manufacturedderivatives are excluded; cultivated roots that fail the 'artificiallypropagated' test count as wildYesRegulation4Genetic resources or knowledge from anothercountry?Access and benefit-sharingAgree benefits in writingBefore collection or cultivation (WHO GACP § 5.1.1). The U.S.signed the CBD in 1993 but is not a PartyYesGuideline · treaty status5A threatened species obtained by cultivation?WHO GACP § 5.1.2Prove it was not wildDocumentation certifying that no wild-collected material isincludedYesGuidelineFive questions for wild-collected or protected botanicals, each with the consequence of answering yes1Collected from the wild?Plants taken from wild populationsPermits firstCollection permits from authorities andlandowners; national red lists respected (WHOGACP § 3.1)Yes · Guideline2Is the species in a CITES Appendix?Check the listing and its annotationExport permit neededInternational trade only with an export permit orre-export certificate (CITES)Appendix II · Treaty3Is it American ginseng (Panax quinquefolius)?50 CFR 23.68(a)Roots are listedWhole, sliced and parts of roots are Appendix II,wild or propagated; powders, extracts, teas andother manufactured derivatives are excluded;cultivated roots that fail the 'artificially propagated'test count as wildYes · Regulation4Genetic resources or knowledge fromanother country?Access and benefit-sharingAgree benefits in writingBefore collection or cultivation (WHO GACP§ 5.1.1). The U.S. signed the CBD in 1993 but is nota PartyYes · Guideline · treaty status5A threatened species obtained by cultivation?WHO GACP § 5.1.2Prove it was not wildDocumentation certifying that no wild-collectedmaterial is includedYes · Guideline
WHO GACP (2003), § 3.1, 5.1.1, 5.1.2; CITES Secretariat, "The CITES Appendices"; 50 CFR 23.68(a) (eCFR, up to date as of October 21, 2026); Convention on Biological Diversity, list of Parties (the United States signed on June 4, 1993).
Text version of the wild-collection questions
  1. Collected from the wild? Obtain collection permits from authorities and landowners and respect national red lists (WHO GACP § 3.1).
  2. In a CITES Appendix? Appendix II trade needs an export permit or re-export certificate.
  3. American ginseng? "Whole plants and roots (whole, sliced, and parts, excluding manufactured parts, products, and derivatives, such as powders, pills, extracts, tonics, teas, and confectionery)" are in Appendix II, "whether wild or artificially propagated"; cultivated ginseng that does not meet the requirements of artificially propagated is considered wild for export (50 CFR 23.68(a)).
  4. Genetic resources or knowledge from another country? Benefit-sharing agreements should be concluded in writing before collection or cultivation (WHO GACP § 5.1.1). The United States signed the Convention on Biological Diversity in 1993 but is not a Party.
  5. A threatened species obtained by cultivation? Documentation should certify that no wild-collected material is included (WHO GACP § 5.1.2).
Explanation, details and sources

CITES Appendix II lists species "not necessarily now threatened with extinction" that may become so unless trade is closely controlled; trade needs an export permit or re-export certificate. U.S. rules for American ginseng cover roots, not manufactured derivatives. The botanical atlas gives the listing status of individual species and the global ingredients page the import steps.

Key terms

Ten terms used in this course

Show the 10 key terms
Bioconcentration factor (BCF)
Element concentration in a plant part divided by that in soil.
Total vs available metal
All of a soil's metal, versus the share an extraction test removes.
Cation exchange capacity
How many positive ions, such as Cd²⁺, soil surfaces can hold.
Partition coefficient (Kd)
Metal held on soil solids divided by metal dissolved in soil water.
Casparian strip
A sealed band in root endodermis walls that forces ions through membranes.
Native DER
Mass of plant material used per mass of extract obtained.
Permitted daily exposure (PDE)
The most of an element USP ⟨2232⟩ allows per day from a supplement.
Chemotype
A plant population of one species with a distinct chemical profile.
Anthesis
The period when a flower is open and functional.
CITES Appendix II
Species traded internationally only with an export permit or re-export certificate.
Check your understanding

Five questions to test the chain from soil to dose

A soil holds 0.4 mg/kg total cadmium and the plant's BCF is 2. What does a 5:1 extract contain if all the cadmium follows it, and what does 2 g/day deliver?

The plant holds 0.4 × 2 = 0.8 µg/g, the extract 0.8 × 5 = 4.0 µg/g, and 2 g/day delivers 8 µg/day. That is above the USP ⟨2232⟩ cadmium PDE of 5 µg/day, so this soil and dose do not fit together unless less cadmium follows the extract.

Why does raising the pH of an acidic field usually lower cadmium uptake?

At higher pH more cadmium is held on clay, organic matter and oxides or precipitates, so less is dissolved at the root. In the cacao synthesis, raising pH from 5 to 7 was modeled to halve the bean-to-soil ratio.

Turmeric from one district contains hundreds of µg/g of lead. Does lead's low BCF make soil an unlikely cause?

Yes. Lead's BCF is very low (0.017 in the wolfberry survey), so a soil explanation would need tens of thousands of mg/kg of lead in the field. In Bangladesh the cause was lead chromate pigment added to turmeric, which testing and supplier control are there to catch.

A grower harvests peppermint in April to get the most oil. What does the Greek field study suggest?

Peppermint oil content was lowest in April (1.01 mL/100 g) and highest in July (3.22), and linalyl acetate fell from 32.8% to 15.3% of the oil. Both the amount and the profile depend on the month.

Does the CITES listing of American ginseng cover a powdered root extract?

No. 50 CFR 23.68(a) lists whole plants and roots, whole, sliced and parts, and excludes manufactured derivatives such as powders, pills, extracts, tonics and teas. Exporting the roots themselves needs CITES documents.

Next: what a certificate of analysis can and cannot prove

Course 6 covers COA panels, elemental impurities, residual solvents, pesticides and mycotoxins.