

Scale-up works when each unit is sized on the right quantity, the powder flows and the knowledge travels
Processability tests, published scale-up rules and the technology-transfer package, shown as figures with their sources.
Status. EUTECNIQ has no plant, pilot equipment, staff or data. Every plan here is proposed.
Academy and related: flow agents and glidants (Course 12) · process engineering
Grau Baquero et al., Materials 2025; Prado et al., J Food Eng 2012; Withouck et al., Foods 2023; FDA, Process Validation (2011). Published results, not EUTECNIQ data.
Each step of an extract train is scaled on, or tested for, its own quantity
Text version of the train
Receipt and quarantine (identity and moisture) → milling (particle size) → sieving → stirred, jacketed extraction (solvent-to-feed ratio; power per volume or tip speed) → filtration (spent marc out) → evaporation (heat-transfer area per volume), with vapor condensed and the solvent recycled to the extractor → resin column → spray drying with air heater, cyclone, bag filter and fan (droplet size, outlet temperature and humidity) → powder (glass transition, water uptake) → blending → sieving → packing (powder flow, hygroscopicity) → QC release against the specification. Downstream, a capsule or tablet maker depends on compressibility and compactibility.
In a published pine-bark extraction, water was 83% of the input and the dried powder 3.9%
Data table (every number in the figure)
| Flow | kg per 2 kg bark | Basis |
|---|---|---|
| Pine bark in | 2.00 | Table 1 |
| Water in | 10.00 | Table 1 |
| Solubilizing agent in | 0.03 | Table 1 |
| Moist residue out | 3.00 | Table 1 |
| Liquid extract out | 9.00 | Table 1 |
| Not closed (inputs 12.03, outputs 12.00) | 0.03 | Table 1, difference |
| Powder from the spray dryer | 0.471 | 438.6 g per 8.38 kg (Table 2) × 9/8.38 |
| Tannins in the powder (52.7%) | 0.248 | Table 2 |
| Other powder solids | 0.223 | difference |
| Water evaporated | 8.53 | difference (trial: 7.94 kg; reported condensate 7.9–8.5 kg) |
| Natural gas, bark trial | 42.1 MJ | 10,056 kcal × 4.184 kJ/kcal |
| Dryer feed rate, bark trial | 5.3 kg/h | 8.38 kg in 95 min |
| Extraction electricity | 5.607 kWh | Table 1 |
Table 2 prints the bark-extract feed as "8380 kg"; with 438.6 g of powder and 7.9–8.5 kg of condensate the feed must be 8.38 kg (8,380 g), and we read it that way.
Most of the mass a plant moves is solvent, so evaporation and solvent handling set the energy bill, not the product.
Explanation, details and sources
The study is a life cycle assessment of tannin extracts made from pine bark, cones and pruning. The moist residue weighs 3 kg against 2 kg of bark fed, so it holds liquid, and that liquid carries extract away unless the cake is pressed or washed. The dryer used 5.3 MJ of natural gas per kilogram of water removed, 2.3 times water's latent heat at its normal boiling point; the difference left as heat in the exhaust air and as equipment losses.
The extract is a tannin for leather tanning, used here only for its published balance. Our own illustrative balance of a 1,000 kg ethanol batch is on the process engineering page.
Two volume readings classify how a powder flows, and above a compressibility index of 25% USP calls it poor
= 100 (V0 − Vf) / V0
Hausner ratio = V0 / Vf
Method, assumptions and limits
- What it calculates
- Bulk and tapped density, the compressibility index and the Hausner ratio of one sample, and the flow class each index falls in.
- Equations
- Compressibility index = 100 (V0 − Vf)/V0 = 100 (ρtapped − ρbulk)/ρtapped; Hausner ratio = V0/Vf = ρtapped/ρbulk; ρ = m/V (USP <1174>).
- Variables and units
- Mass in g; volumes in mL of the same sample; densities in g/mL.
- Classes
- Index ≤ 10 excellent, 11–15 good, 16–20 fair, 21–25 passable, 26–31 poor, 32–37 very poor, > 38 very, very poor; ratio 1.00–1.11, 1.12–1.18, 1.19–1.25, 1.26–1.34, 1.35–1.45, 1.46–1.59, > 1.60. The tool rounds the index to a whole number and the ratio to two decimals before classing, and places 38 and 1.60, which the table leaves unassigned, in the last class.
- Valid range
- 10–200 g; 50–250 mL; the tapped volume is held at or below the bulk volume.
- What it does not establish
- The result depends on the cylinder, the tapping method and the sample's history, so powders are compared only under one method. Flow under consolidation, as in a hopper, is characterized by the shear-cell method.
- Verification
- Unit tests in
tests/unit/proc_su.test.js; independent Python reference intests/numerics/ref/technologies-scale-up-tech-transfer.py.
A blend that drifts from fair to poor flow fills capsules and dies unevenly, which shows up as weight variation.
Explanation, details and sources
For the compressibility index and Hausner ratio, a sample of known mass is poured into a graduated cylinder (unsettled volume V0) and tapped until the volume stops changing (Vf). A powder that packs down a lot under tapping has strong interparticle forces and flows poorly. Carriers, granulation or a glidant can change the class. Silicon dioxide as a flow agent is covered in Course 12, other ingredients.
A hygroscopicity class is one weight gain at 80% humidity; a sorption isotherm shows the whole curve
Data table (g water per 100 g dry matter)
| Material | Wm | C | K | 10% RH | 30% RH | 50% RH | 70% RH | Critical RH, measured |
|---|---|---|---|---|---|---|---|---|
| Mango solids | 16.1 | 1.686 | 0.920 | 2.6 | 8.7 | 17.6 | 34.1 | 7.4% |
| Mango : maltodextrin 20 : 80 | 6.4 | 2.303 | 0.922 | 1.3 | 4.1 | 7.9 | 14.6 | 34.5% |
| Maltodextrin | 4.3 | 9.192 | 0.995 | 2.4 | 4.9 | 7.7 | 13.5 | 57.5% |
The class is a single test point; the isotherm tells a plant what room humidity keeps the powder glassy while it is blended and packed.
Explanation, details and sources
The pharmacopoeial test stores the material at 25 °C and 80% relative humidity for 24 hours and classes it by weight gain: slightly hygroscopic from 0.2% to under 2%, hygroscopic from 2% to under 15%, very hygroscopic at 15% or more, deliquescent when it takes up enough water to form a liquid. It does not account for the water already in the sample. An isotherm gives equilibrium water content across humidity; the data used here stop at 70%, so the 80% test point lies outside them. Storage and packaging consequences are on the drying and particle engineering page.
A spray-dried powder sticks to the chamber when it leaves hotter than its glass transition, and a carrier raises that transition
Method, assumptions and limits
- What it calculates
- The glass-transition temperature of each material at the chosen water content and its difference from the outlet air temperature.
- Equations
- Gordon–Taylor as shown, with ws = 1/(1 + W/100) and ww = 1 − ws, W in g water per 100 g dry matter; Tgs 310.4, 366.1 and 435.8 K and k 3.86, 7.18 and 9.00 (Kashiwakura et al. 2024).
- Assumptions
- The outlet air temperature is taken as an upper bound for the particle temperature at the dryer exit; amorphous powder; the 10 °C line marks where reported sticky points begin, not a design limit.
- Valid range
- Outlet 40–110 °C; 1–8 g water per 100 g dry matter.
- What it does not establish
- Whether a given extract deposits in a given dryer: wall deposition also depends on particle velocity, contact time and the dryer's airflow, and is measured in trials.
- Verification
- Unit tests and the independent Python reference named above.
At the defaults, 70 °C and 4 g of water per 100 g, mango solids sit 56 °C above their glass transition, the blend 28 °C above, maltodextrin 13 °C below.
Explanation, details and sources
Sugar-rich extracts have a low glass transition, so they turn sticky in the hot, humid lower part of a spray dryer and coat its walls (Bhandari et al. 1997). Adding a high-Tg carrier such as maltodextrin, lowering the outlet temperature or drying further all move the particle below the sticky point. Each costs something: carrier dilutes the active, a cooler outlet leaves more water, and drier air needs more energy.
Tablet strength at production speed is predicted best from tensile strength against solid fraction
Measure all three profiles on the development press, then carry the compactibility curve to the production press.
Explanation, details and sources
Compressibility is solid fraction against compaction pressure, tabletability is tensile strength against pressure, and compactibility is tensile strength against solid fraction. Tye, Sun and Amidon tested four direct-compression excipients and a placebo: tabletability and compressibility of some changed with tableting speed, while compactibility of all of them was essentially speed independent. Tensile strength comes from the force F that breaks a tablet of diameter D and thickness t across its diameter: σ = 2F/(πDt).
A larger, geometrically similar tank cannot hold power per volume, tip speed and Reynolds number constant at once
P/V: N2 = N1k−2/3
tip speed: N2 = N1k−1
Re: N2 = N1k−2
blend time: N2 = N1
| Rule held constant | Plant speed | Power | P/V | Tip speed | Re |
|---|
Method, assumptions and limits
- What it calculates
- The plant impeller speed under four scale-up rules and the resulting power, power per volume, tip speed, Reynolds number and blend time relative to the laboratory; the same model draws the 3D map below.
- Equations
- k = (V2/V1)1/3; P = PoρN³D⁵; tip speed πND; Re = ρND²/μ.
- Variables and units
- Volumes in L; N in rpm (÷ 60 to s⁻¹); D = (D/T)·T in m with T = (4V/π)1/3; ρ = 998 kg/m³; μ 1.002–100 mPa·s (logarithmic slider).
- Assumptions
- Geometric similarity, baffled tanks, one impeller, liquid height equal to diameter; constant power number, which needs turbulent flow (Re above about 10⁴, flagged otherwise). Turbulent blend time scales as 1/N in a fixed geometry, so only its ratio is shown.
- Valid range
- Laboratory 1–50 L; plant 100 L to 20 m³ (logarithmic slider, two significant figures).
- What it does not establish
- Solids suspension, gas dispersion and heat transfer have their own correlations; local shear near the impeller differs from the averages shown.
- Verification
- Independent Python reference in
tests/numerics/ref/technologies-scale-up-tech-transfer.py.
Data table: power per volume, W/m³, at the calculator's D/T and Po
| Volume | 50 rpm | 100 rpm | 200 rpm | 400 rpm | 800 rpm |
|---|
Constant power per volume keeps droplet and suspension behavior closer; it lengthens blend time and lowers tip speed.
Explanation, details and sources
In turbulent flow the impeller draws power P = PoρN³D⁵. With every length scaled by k, holding one quantity fixes the plant speed and moves the rest. The rule is chosen by what the step is sensitive to: dispersion and mass transfer follow power per volume, shear-sensitive material follows tip speed, and a reaction that needs fast mixing follows blend time, which is usually the most expensive to hold.
A thousandfold larger vessel has a tenth of the jacket area per liter, so it heats and cools more slowly
Where a step is temperature critical, coils or external exchangers restore the area that scale removes.
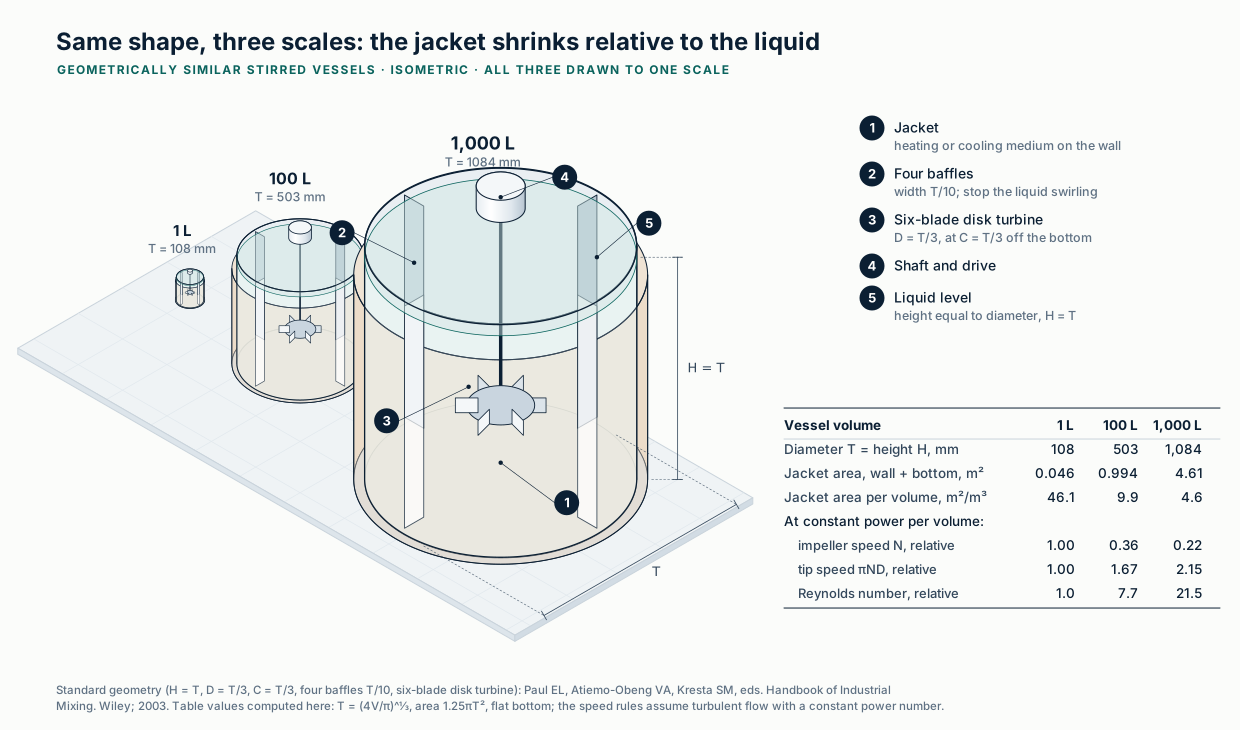
Each unit operation has its own published scale-up basis, and one pilot study shows what happens when it is not held
Data table
| Scale | Probe power | Acoustic energy density |
|---|---|---|
| 200 mL laboratory | 50 W | 225 ± 5 W/L |
| 1,000 mL laboratory | 50 W | 45.0 ± 0.1 W/L |
| 100 L pilot | 950 W | 9.5 ± 0.1 W/L |
A scale-up basis is chosen from the mechanism, then confirmed at pilot scale; matching one variable is rarely enough.
Explanation, details and sources
For supercritical CO₂ extraction of grape seed, keeping the solvent-to-feed ratio constant predicted the 5.15 L pilot curve from the 0.29 L laboratory one at 35 MPa and 313 K (Prado et al. 2012). For spray drying, Poozesh and Bilgili review rules for atomization, drying and gas–solid separation; Thybo et al. matched droplet size between a pilot and a production dryer and still needed production trials, because mixing and residence time differed. In the applewood study the pilot yield was lower at a solid-to-solvent ratio of 1 : 33 and at least 30% higher at 1 : 20, which the authors attribute to energy density and to suspension of the wood.
Technology transfer moves product and process knowledge, with the documents, from the unit that developed a process to the one that will run it
ICH Q10 names the goal: transfer knowledge "to achieve product realisation", forming the basis for the process, control strategy and validation approach.
Explanation, details and sources: the transfer package
| Element | Content | Anchor |
|---|---|---|
| Process description | Route, unit operations, sequence, set points and ranges, in-process controls, hold times | WHO TRS 1044 Annex 4 |
| CQAs and CPPs | Critical quality attributes and the process parameters that move them, with the evidence behind each link | ICH Q8(R2) definitions |
| Specifications | Raw material, in-process and finished specifications with justification | 21 CFR 111.70 (supplements) |
| Analytical method transfer | Comparative testing, covalidation, revalidation or a justified waiver, under a pre-approved protocol | USP <1224> |
| Risk assessment | Equipment and scale gaps between sending and receiving units, ranked with mitigations | ICH Q9(R1) |
| Records | Master manufacturing record for each formulation and batch size; batch production record for every batch | 21 CFR 111.205, 111.255 |
| Run evidence | Engineering runs, then qualification batches (process performance qualification where drug rules apply) | FDA Process Validation guidance (2011) |
| Knowledge management | Development history, deviations and model data kept usable across the lifecycle | ICH Q10 |
ICH Q10 defines knowledge management as a "systematic approach to acquiring, analysing, storing and disseminating information related to products, manufacturing processes and components". For dietary supplements the receiving unit's master manufacturing and batch production records are requirements of 21 CFR Part 111.
FDA's process-validation guidance runs in three stages and covers drugs, not dietary supplements
EUTECNIQ would borrow the lifecycle logic for supplement processes while meeting Part 111's own record requirements.
Explanation, details and sources
The guidance defines process validation as "the collection and evaluation of data, from the process design stage through commercial production, which establishes scientific evidence that a process is capable of consistently delivering quality product." Products made during Stage 2 can be released if acceptable, and Stage 2 must succeed before commercial distribution.
After a process change, products are compared against criteria set in advance, and there are five possible outcomes
Q5E was written for biotechnological products; for a botanical extract EUTECNIQ would apply its logic with fingerprints, marker assays and stability.
Explanation, details and sources
Q5E defines "comparable" as "a conclusion that products have highly similar quality attributes before and after manufacturing process changes and that no adverse impact on the safety or efficacy, including immunogenicity, of the drug product occurred." The comparison draws on routine batch analyses, in-process controls, validation data, characterization and stability. How fingerprints and markers are compared is on the purification and standardization page.
Six proposed gates would move a process from grams to routine production, each released only by evidence
Text version: gates, evidence and typical scale
| Gate | Evidence required to pass | Typical scale |
|---|---|---|
| G0 Feasible | Target constituents extracted and measured with a fit-for-purpose method; no safety or regulatory stopper found | Grams |
| G1 Defined | Designed experiments identify the parameters that move each CQA; ranges proposed; stability screening started | Liters |
| G2 Piloted | Mass and energy balances close within an agreed tolerance; heat-up, filtration and drying parameters measured; material for customer and safety studies | Tens to hundreds of liters |
| G3 Transfer-ready | Process description, CQAs and CPPs, specifications, risk assessment, master manufacturing record and transferred methods approved by the quality unit | Pilot to plant |
| G4 Qualified | Qualification batches at commercial scale meet all specifications; deviations investigated and closed | Cubic meters |
| G5 Routine | Trends of CPPs and CQAs show the process stays in control; changes go through change control | Commercial |
Moving a botanical process toward manufacturing?
Describe the material and the step; EUTECNIQ would respond with a proposed processability and transfer plan and its limits.