

An emulsion lasts only while its droplets do not rise, cluster, merge or ripen; small droplets alone prevent none of these
How nanoemulsions differ from microemulsions, the five ways an emulsion changes on the shelf, and the physics that sets each rate.
Status. EUTECNIQ has no laboratory, homogenizer, formulation or stability data; formulation work is planned for the Phase I laboratory (facility plan, October 2026). Every curve is an educational model or a published value.
Kim et al., Prev Nutr Food Sci 2016, Table 2; Qian et al., Food Chem 2012; Stokes' law (McClements, Food Emulsions, 2015); Patrignani et al. 2019; Romano et al. 2021.
Left alone, an emulsion coarsens as small droplets dissolve into larger ones and the mean radius cubed climbs
Droplets left 130 of 130Mean radius 1 × startTime τ 0.0Oil volume kept 100.0%
Ripening speed scales with the oil's solubility in water: with a 100-fold less soluble oil, the same droplets barely change over the same time.
Explanation, details and sources
Oil dissolves slightly into the water around each droplet, more so around small, strongly curved ones (Laplace pressure). Oil therefore diffuses from droplets smaller than the mean to larger ones; the small ones vanish and the number of droplets falls while the total oil volume stays the same. In the mean-field theory the critical radius equals the number-mean radius, which conserves volume exactly. The rate constant k stands for c(∞)γVmD/(ρRT); its physical value for a chosen oil is computed in the calculator further down this page, and measured ripening rates for a published nanoemulsion are charted beside it.
Limits: dilute emulsion, no coalescence, creaming or flocculation, no micelle-assisted transport. Real emulsions are measured (see the measurement section).
Delivery claims for oil-soluble botanicals rest on emulsion physics that can be measured long before any human study
Text version of the evidence ladder
- Physical stability of the droplets: size, charge, cream layer and free oil tracked over time and under stress. It does not show that the active itself survives.
- Chemical stability of the active: a validated assay of the active over the same storage. A stable laboratory batch is not a validated commercial shelf life.
- Dispersibility in water: a fine, stable dispersion of an oil-soluble active. It is not solubility in water, and not absorption.
- Bioaccessibility: release into a digestion model, which ranks formulations. It is not systemic bioavailability.
- Systemic bioavailability: exposure in the blood, shown only by human pharmacokinetic data. It is not clinical efficacy.
- Nanoemulsion stability≠demonstrated bioavailability
- Dispersibility in water≠solubility in water
- Droplet radius below 100 nm≠a microemulsion
- Bioaccessibility in a digestion model≠systemic bioavailability
- Physical stability≠chemical stability of the active
- A stable laboratory batch≠a validated commercial shelf life
Explanation, details and sources
A lipophilic active, one that dissolves in oil rather than water, can be carried in oil droplets dispersed in water. Each rung of evidence below needs its own measurement.
- Choose oil, emulsifier and process for an active
- Measure size, charge and change over time
- Stress-test dilution, pH, temperature, freeze–thaw
- Transfer a working process to pilot scale
- Measure before EUTECNIQ's laboratory exists
- Provide imaging such as cryo-electron microscopy
- Run digestion models or human studies
- Formulation, droplet-size or stability data
- That small droplets raise absorption in people
- A proprietary delivery technology
Nanoemulsions and microemulsions can share a droplet size; thermodynamics is what separates them
State 1: separated oil and water. State 2: dispersed droplets. In a nanoemulsion state 1 has the lower free energy, so state 2 survives only because the barrier slows breakdown; in a microemulsion state 2 is the minimum at its composition and temperature.
After McClements DJ. Soft Matter. 2012;8(6):1719–1729. The formation free energy is ΔGformation = γΔA − TΔSconfig: the interfacial tension γ times the new interface ΔA, minus the configurational entropy gained by dispersing the droplets. Curve shapes are drawn for explanation only.McClements DJ. Nanoemulsions versus microemulsions: terminology, differences, and similarities. Soft Matter. 2012;8(6):1719–1729. The response row is an inference from the stability definitions, not a quoted result.
Explanation, details and sources
A microemulsion is thermodynamically stable and forms on its own at the right composition and temperature. A nanoemulsion is unstable and lasts only because breakdown is slow, called kinetic stability (McClements 2012). Both can have droplet radii below about 100 nm.
| Property | Nanoemulsion | Microemulsion |
|---|---|---|
| Thermodynamic status | Unstable; persists because breakdown is slow (kinetic stability) | Stable at its composition and temperature |
| How it forms | Needs energy input, such as a high-pressure homogenizer or ultrasound, or a low-energy route that traps fine droplets | Forms spontaneously once the right components are combined |
| Droplet radius | Can be below about 100 nm | Below about 100 nm |
| Response to dilution or heating | Droplets persist for a time, then break down by the mechanisms below | Can change structure or break down once dilution or temperature moves it outside its stability region |
| How to tell them apart | Behavior over time and after perturbation, not droplet size | |
Creaming can be undone by mixing; coalescence, ripening and phase separation cannot
Text version: the five mechanisms
Each mechanism has its own driving force and remedy. Kinetic stability is a rate, so it is measured at the conditions of use and over time.
| Mechanism | What happens | Driving force | Reversible? | What slows it | How it would be measured |
|---|---|---|---|---|---|
| Creaming or sedimentation | Droplets move up (oil lighter than water) or down, but stay intact | Gravity acting on the density difference | Yes, by gentle mixing, if no droplets have merged | Smaller droplets, a smaller density difference, a more viscous water phase | Cream-layer height or backscatter along the container over time |
| Flocculation | Droplets cluster but keep their own interfacial films | Attraction between droplets exceeds electrostatic or steric repulsion | Often, for weak flocs | Surface charge or a thick adsorbed layer; control of pH and salt | Microscopy; apparent size growth; zeta potential as a guide |
| Coalescence | The film between two droplets ruptures and they merge | Lower total interfacial energy | No | A dense, well-anchored emulsifier layer; small droplets | Growth of the droplet-size distribution; free oil |
| Ostwald ripening | Oil dissolves from small droplets, diffuses through water and deposits on large ones | Higher solubility next to small, curved droplets (Laplace pressure) | No | Oils with very low water solubility, or an added insoluble oil | Mean radius cubed rising linearly in time (LSW theory) |
| Phase separation | A continuous oil layer forms, or the emulsion inverts | End point of coalescence | No | Preventing the mechanisms above | Visible oil layer; oil quantified after storage |
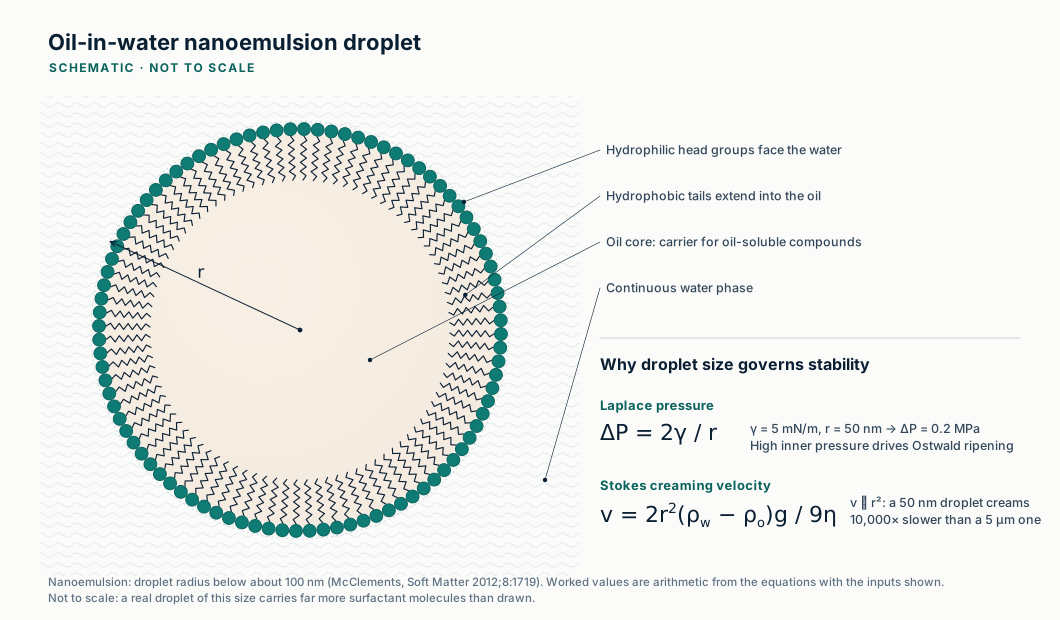
Creaming speed rises with the square of droplet size, so a tenfold smaller droplet creams a hundred times more slowly
Method, assumptions and limits
- What it calculates
- The rise (or settling) speed of one droplet, the time to cross the liquid height at that speed, and the gravitational length at 25 °C.
- Equations
- v = 2r²Δρg/(9η); t = H/v; lg = kBT/((4/3)πr³Δρg). The concentration of droplets at equilibrium falls with height as exp(−z/lg).
- Variables and units
- r droplet radius (m); Δρ density difference (kg/m³); g = 9.80665 m/s²; η viscosity (Pa·s); H liquid height (m); kB = 1.380649 × 10⁻²³ J/K; T = 298.15 K. Dimensions: (m²·kg/m³·m/s²)/(Pa·s) = m/s.
- Assumptions
- Dilute emulsion; rigid, non-interacting spheres; Newtonian water phase; no convection. A denser oil sediments at the same speed.
- Valid range
- Particle Reynolds number far below 1, true for every setting here. Droplet diameters 20 nm to 20 µm; viscosity 0.89 to 1,000 mPa·s.
- What it does not establish
- Concentrated emulsions cream more slowly than Stokes predicts; flocculated droplets cream faster as clusters; thickened or gelled water phases need measured rheology. It says nothing about coalescence, ripening or chemical stability.
- Verification
- Independent Python reference cases in
tests/numerics/ref/technologies-emulsions-colloids.py, checked against the page bytests/e2e/numerics.js.
Explanation, details and sources
Stokes' law gives the speed of an isolated droplet in a still liquid. Below a certain size, Brownian motion spreads droplets faster than gravity collects them; the gravitational length marks that crossover.
Three devices tear droplets apart with force; low-energy methods let chemistry do the work
Text version of the temperature rise
At 2–2.5 °C per 10 MPa, one pass raises the temperature by 10–12.5 °C at 50 MPa, 20–25 °C at 100 MPa, 30–37.5 °C at 150 MPa and 40–50 °C at 200 MPa. An adiabatic energy balance gives 2.4 K per 10 MPa for a water-like product (2.5 K with cp 4.0 kJ/(kg·K)). Each pass and each step up in pressure buys a smaller droplet, with fast diminishing returns.
Explanation, details and sources
High-energy devices break droplets apart, and the emulsifier must cover the new interface before fragments merge. Low-energy methods form fine droplets when the right oil–surfactant mixture meets water.
A sub-second burst of pressure and shear
- Pressure: 50–200 MPa; size falls with pressure and passes
- Heat: 2–2.5 °C per 10 MPa per pass (chart above)
- Time: under 1 s in the valve
Two jets collide in an interaction chamber
- Size: falls with passes and pressure
- Chambers: Y- and Z-type designs are common
Collapsing cavitation bubbles tear droplets
- Size: set by time, intensity, emulsifier and viscosity
- Risk: can denature proteins, depolymerize polysaccharides or oxidize lipids
- Use: refines an emulsion or emulsifies in one step
Chemistry instead of force
- Heat: none for spontaneous emulsification; the phase-inversion temperature method warms, then cools
- Cost: a high surfactant-to-oil ratio, usually synthetic
- Watch: stability on dilution or changed conditions
Small droplets feed large ones, and the oil's water solubility sets the pace
Method, assumptions and limits
- What it calculates
- The LSW ripening rate for a limonene-like oil of chosen water solubility, the mean diameter over time and the time for the mean diameter to double.
- Equations
- ω = (8/9)(c(∞)/ρ)(γVm/RT)D; r³(t) = r0³ + ωt; doubling the diameter needs t = 7r0³/ω.
- Variables and units
- c(∞) oil solubility (kg/m³); ρ = 840.2 kg/m³ and M = 0.13623 kg/mol for limonene, so Vm = M/ρ (m³/mol); γ = 5 mN/m and D = 7 × 10⁻¹⁰ m²/s (examples); R = 8.314 J/(mol·K); T = 298.15 K. ω comes out in m³/s.
- Assumptions
- Steady-state ripening of a dilute emulsion; no coalescence, creaming or flocculation; interfacial tension and diffusivity fixed.
- Valid range
- Solubility 10⁻⁴ to 100 mg/L; starting diameter 60–300 nm. The curve is clipped at 1 µm.
- What it does not establish
- Absolute times depend on the example γ and D; real emulsions are measured. Mixtures of oils, surfactant micelles and polydisperse droplets can ripen faster or slower than LSW predicts.
- Verification
- Independent Python reference cases in
tests/numerics/ref/technologies-emulsions-colloids.py.
Data table (Kim et al. 2016, Tables 1 and 2)
| Pressure | Emulsifier (wt%) | Day 1, nm (PdI) | Day 28, nm (PdI) | ω, × 10⁴ nm³/h (R²) |
|---|---|---|---|---|
| 5,000 psi | Tween 20 (10) | 106.97 (0.139) | 121.80 (0.096) | 9.07 (0.9808) |
| 5,000 psi | Tween 20 : sorbitan monooleate (6:4) | 89.13 (0.097) | 94.71 (0.110) | 2.54 (0.8446) |
| 5,000 psi | Tween 20 : soy lecithin (6:4) | 105.50 (0.135) | 109.30 (0.124) | 1.91 (0.8292) |
| 10,000 psi | Tween 20 (10) | 85.85 (0.160) | 111.37 (0.104) | 11.65 (0.9953) |
| 10,000 psi | Tween 20 : sorbitan monooleate (6:4) | 77.44 (0.098) | 82.24 (0.106) | 1.72 (0.8457) |
| 10,000 psi | Tween 20 : soy lecithin (6:4) | 77.21 (0.146) | 86.33 (0.131) | 3.16 (0.8972) |
| 15,000 psi | Tween 20 (10) | 89.08 (0.137) | 109.23 (0.114) | 9.68 (0.9876) |
| 15,000 psi | Tween 20 : sorbitan monooleate (6:4) | 73.43 (0.081) | 77.38 (0.084) | 1.32 (0.7879) |
| 15,000 psi | Tween 20 : soy lecithin (6:4) | 67.68 (0.143) | 77.88 (0.141) | 2.76 (0.9022) |
Rate ratios (Tween 20 alone ÷ mixed system) are computed here: 3.6 and 4.7 at 5,000 psi, 6.8 and 3.7 at 10,000 psi, 7.3 and 3.5 at 15,000 psi. The linear fits for the mixed systems are weaker (R² 0.79–0.90). 5,000, 10,000 and 15,000 psi are 34.5, 68.9 and 103.4 MPa.
Explanation, details and sources
Oil dissolves slightly into the water around each droplet, more so around small ones. Oil therefore migrates from small droplets to large ones, and the cube of the mean radius grows linearly in time (Lifshitz–Slyozov–Wagner, or LSW, theory).
A self-emulsifying mix must stay finely dispersed along its whole dilution path, and only a measured phase diagram shows it
Mix A stays fine all along its dilution line; mix B, with less surfactant, does not. Only a measured diagram shows which a real blend does.
Explanation, details and sources
Oil, surfactant and cosurfactant blends disperse into fine droplets when diluted, as in the gut. The region where they do so is mapped by titration for each pair.
- Pick the oilLow water solubility resists ripening; the oil also has to dissolve the active.
- Map the diagramTitrate oil–surfactant mixes with water and record where they stay clear.
- Make and measureSize by light scattering, then track it over time and through dilution.
- Test the claim separatelySmall droplets disperse an active; only human data show better absorption.
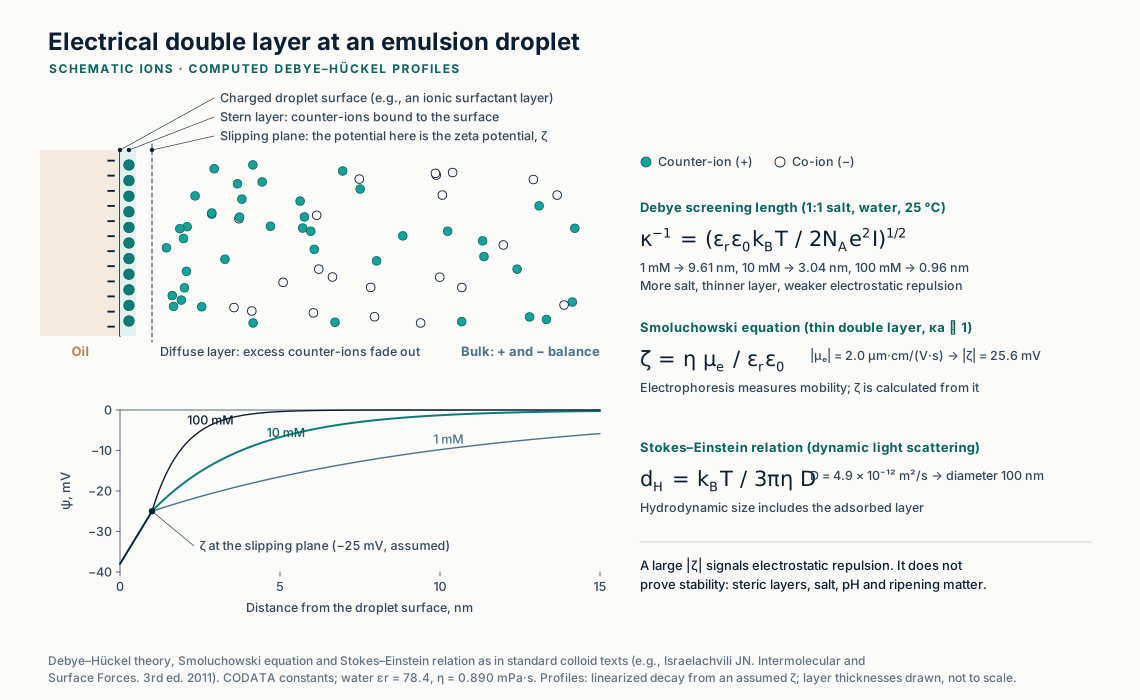
No single measurement shows that an emulsion is stable, so size, charge, appearance and the active are tracked together
Show the table (6 rows)
| Method | What it reports | Main limit | Standard |
|---|---|---|---|
| Dynamic light scattering | Hydrodynamic diameter (z-average) and polydispersity of droplets below about a micrometer | Intensity-weighted: a few large droplets or dust dominate | USP ⟨430⟩; ISO 22412:2025 |
| Laser diffraction | Volume-weighted size distribution; catches the micrometer tail that signals coalescence | Model-based inversion needs refractive indices | USP ⟨429⟩; ISO 13320:2020 |
| Electrophoretic light scattering | Zeta potential, a guide to electrostatic repulsion between droplets | Depends on pH and salt; it predicts, it does not measure, stability | Method-specific |
| Optical and electron microscopy | Direct images of droplets, flocs and crystals | Small fields of view; preparation can create artifacts | USP ⟨776⟩ for optical microscopy |
| Storage and stress tests | Cream layer, free oil and size change after storage, dilution, pH change, centrifugation or temperature cycling | Stress results rank formulations; they do not set a shelf life | Protocol-specific |
| Assay of the active | Chemical stability: whether the active itself degrades | A physically stable emulsion can still lose its active to oxidation | Validated chromatographic method |
USP general chapters ⟨429⟩, ⟨430⟩ and ⟨776⟩ (USP–NF); ISO 22412:2025, Particle size analysis — Dynamic light scattering (edition 3, September 2025; replaced the withdrawn 2017 edition); ISO 13320:2020 (laser diffraction, about 0.1 µm to 3 mm); McClements 2007 for the use of several complementary stability methods.
Explanation, details and sources
Each method sees part of the picture. A sound stability study measures several of them at the same time points, under storage and stress conditions. Instrument principles are on the analytical page.
A stable nanoemulsion improves how an oil-soluble active disperses; whether it improves absorption in people is a separate question
Data table
| Carrier oil | Bioaccessibility | Reason given by the authors |
|---|---|---|
| Long-chain triglyceride | ≈66% | Mixed micelles formed that could solubilize β-carotene |
| Medium-chain triglyceride | ≈2% | Mixed micelles too small to solubilize β-carotene |
| Orange oil | ≈0% | No mixed micelles formed |
Droplet size did not decide the result; the oil's digestion products did. Bioaccessibility in a model is still not absorption in people.
Explanation, details and sources
McClements (2011) describes nanoemulsions as able to increase bioavailability and also notes possible risks from changing the biological fate of components. EUTECNIQ would therefore treat a delivery benefit as a hypothesis: digestion models can rank formulations, and only human pharmacokinetic data establish systemic exposure.
Discuss a delivery-system question
Partners with an oil-soluble botanical active can describe the problem; EUTECNIQ would respond with a proposed study plan and its limits.